

Revenue grew across our industry this quarter. Margins didn't. This issue follows the gap.
Welcome to the first edition of The Quarterly Review.
Thank you for being here. You made a decision to invest in Wash Weekly, and The Quarterly Review is built to make that investment compound. Every quarter, we pull data from more than 60 economic and industry sources, from federal agencies and SEC filings to central bank releases and trade association surveys, and connect each one directly to how our laundry businesses operate. Not in theory, but in the specific ways that the broader economy shows up in our utility bills, our lease negotiations, our clients' spending patterns, and the lending environment we borrow in. Every number is sourced and every connection is cited.
This issue covers Q2 2026, April through June. The data tells a story worth sitting with. Operator net margins compressed to 22% even as 55% of stores reported revenue growth. Equipment replacement costs rose to the #1 problem in our industry, with utilities close behind at #2. Water and sewer rates have outpaced overall inflation by more than two to one over the past quarter century. The renter population that walks through our doors is carrying more financial stress, with 12 to 19 million households unable to afford basic water service. GDP growth softened to 1.2% and banks tightened commercial lending standards. We break all of it down across ten sections, each built to show us what the data reveals about the business we're all running.
This is the first issue. The Quarterly Review will sharpen over time the same way Wash Weekly has, through the writing and doing. What won't change is the standard we hold it to. There's a feedback link at the end of this issue, and there will be one in every issue for you to share thoughts, suggestions, and opinions. I read every single one.
Waleed Cope
Brian Riseland · Laundry Genius
Nicholas Gomez · Super Kleen Laundry
Joe Toner · Dash Point Laundry
Sharon Brinks · The Laundry Station
Kent Wales · Happy Laundry & Dry Cleaning
Steve Brinks · The Laundry Station
The laundromat business runs on renters. Not exclusively, but disproportionately. The households that use self-service laundry most frequently are the same households that rent their housing, live in multifamily buildings, and feel changes in the cost of living before almost anyone else. When housing costs rise, when utility bills climb, when credit gets tighter, those pressures show up in our stores through our clients before they show up in the headlines. This section connects the housing and consumer data from Q2 2026 to the laundry business we operate every day.
According to Yardi Matrix's May 2026 National Multifamily Report, the average asking rent nationally reached $1,767 per month, up 0.2% year over year. That number looks flat, and in percentage terms it is. But context matters here, rents are approximately 18% above where they were five years ago, as cited in the Eviction Lab's 2025 annual report. Multifamily occupancy dropped to 94.1% in April, the lowest level since 2013 per Yardi. More units are available, but the price floor hasn't come down meaningfully. For the renter households walking into our stores, housing remains a dominant line item, and the share of renters crossing the cost-burden line sits at a record.⁵
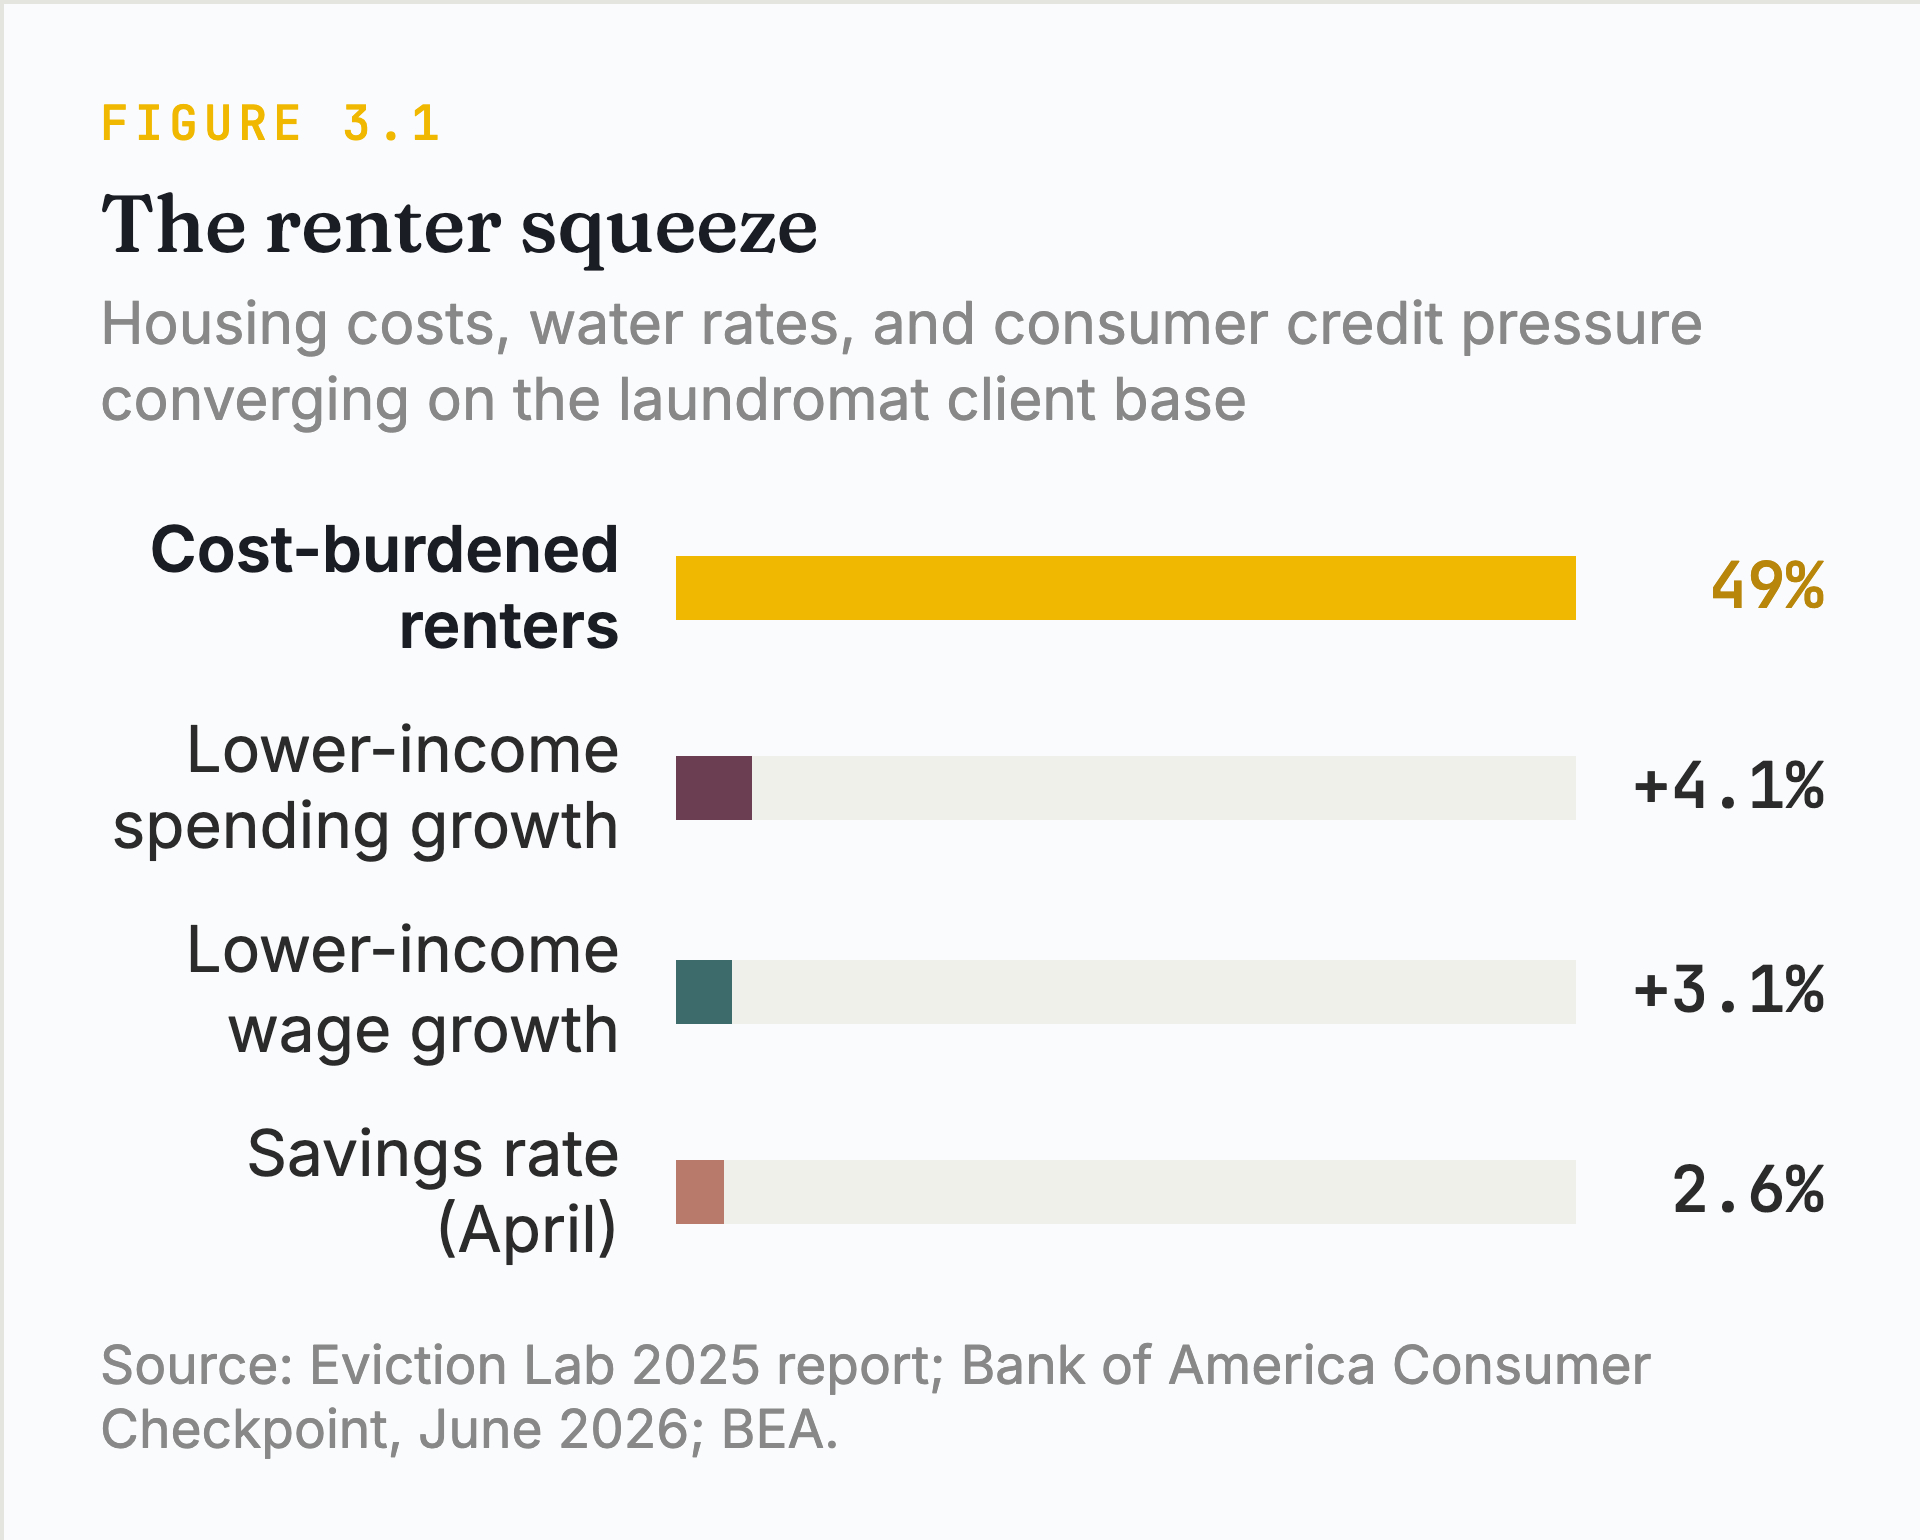
That cost burden has a serious downstream effect. When nearly half of all renters spend 30% or more of their income on housing alone, every other bill gets scrutinized. The Eviction Lab's 2025 Eviction Tracking System report recorded 1.23 million eviction filings, roughly 1 filing for every 13 renter households. That's a slight decline from 2024, down 2.4%, but remains 3.2% above the post-pandemic average. In Atlanta, landlords filed eviction cases against roughly 1 in 4 renter households. The data also reveals a demographic pattern: African American renters represent 28% of the renter population but account for an estimated 39% of eviction filing defendants, according to the Eviction Lab's analysis.⁶
Now add utility costs to the picture. Water and sewer rates have approximately tripled since 1998, growing more than twice as fast as overall consumer prices, according to BLS data presented in the EPA's December 2024 Water Affordability Needs Assessment. Between 12.1 million and 19.2 million U.S. households spend more than 3% to 4.5% of their income on water and sewer service, the threshold the EPA defines as unaffordable. In rental housing, these costs typically flow through to tenants either directly or through rent increases as landlords absorb higher utility expenses. Either way, the household paying for laundry at our stores is also absorbing these increases at home.⁷
Meanwhile, the consumer credit data says these same households are stretching. Lower-income household spending grew 4.1% year over year while after-tax wages for that group grew 3.1%, per Bank of America's June 2026 Consumer Checkpoint. Section 6 breaks the full spending picture down. What matters here is that the pressure lands directly on the households most likely to be our regular clients.⁸
Foreclosure activity adds one more layer. ATTOM's Q1 2026 data shows total foreclosure filings up 26% year over year, with 15 or more consecutive months of annual increases. These volumes remain below pre-pandemic levels, but the direction is consistent. Florida, Texas, and California lead in both foreclosure starts and completed repossessions.⁹
The conventional thinking in our industry and society is that laundromats are recession-proof because people always need clean clothes. That's true at the category level, but not at the store level. When money gets tight, clients get creative. They reduce frequency, they wash at a friend's or family member's house, find a cheaper store down the road, whether it's older with lower prices or newer and trying to build volume. The need doesn't disappear, but where and how often they meet that need absolutely changes. The data in this section says the client base is under more financial pressure than a year ago. That's worth factoring into decisions we are making right now, from vend pricing to capital investment to how we think about the experience inside our four walls.
For the first time, in the 2025 CLA survey, the cost of replacing or purchasing new equipment was reported by 64% of the responders, the highest of any category. Utilities, which held the top position in the 2024 survey at 53%, dropped to #2 at 51%. But the broader cost picture hasn't eased. Nine out of ten owners/operators (89%) identified at least one high cost category as a top problem. Insurance came in at 39%, labor at 35%, machine maintenance at 32%, and rent at 20%. The cost pressure isn't just concentrated in one line item. It's spread across the entire P&L (profit and loss statement, the financial summary of revenue minus all expenses).¹⁰
On the electricity side, commercial rates averaged 13.92 cents per kWh in March 2026, up 5.8% year over year according to the EIA. Forty-one states plus DC saw year-over-year price increases in April. The Center for American Progress and NRDC track a broader picture, 242 utilities across 49 states are implementing or proposing rate increases between 2025 and 2027, representing $92.9 billion in combined revenue increases through 2028. Electricity prices rose 2.5 times faster than inflation in 2025. For a business that runs commercial washers and dryers all day, every fraction of a cent per kilowatt-hour compounds.¹¹