
A few months ago, I was looking at a laundromat listing in my market. The asking price was a number that, five years ago, would have drawn skepticism from any experienced owner/operator. Something about the number made me pause. Not because the store was bad. Because I had no way to know if the price was high relative to conditions, or if conditions had shifted and this was the new normal.
In real estate, I'd check months of inventory. In the stock market, I'd look at where the index sits relative to its 52-week range. In laundry, I had nothing to reference. No index. No transaction history. No shared vocabulary for describing whether the market in my area was running hot, cooling off, or holding steady.
That absence is what led me to look deeper. I started searching for any instance, anywhere, of someone saying, "The laundromat market is overheated right now. Consider waiting." I looked through trade publications, industry events, Facebook groups, forums, LinkedIn, YouTube, Instagram. Years of content about investing in laundromats.
I couldn't find it. The absence was striking.
The closest I found was a 2008 Forbes article that listed "Laundry Services" among "America's Fastest-Dying Industries," alongside video stores and payphones. The article contained factual errors, including citing 12,000 establishments when the actual number was higher, and it conflated self-service laundromats with institutional laundry route companies like Coinmach and Mac Gray. Industry commentator Larry Larsen published a detailed rebuttal.¹ A market research report projects a "flat to slightly negative" outlook for the U.S. laundromat count through 2030.²
Beyond those two moments, the language around laundromat investing has stayed remarkably consistent for years: "Recession-proof." "95% success rate." "20-35% ROI." "Passive income potential."
When you examine why that language never shifts, the answer turns out to be more structural than promotional. The measurement tools that would give it reason to change were never built.
How other industries learned to read the room
The Dow Jones Industrial Average has tracked stock market conditions since 1896.³ The S&P 500 has reported daily since 1957. The CBOE Volatility Index, known as the VIX, gives investors a real-time reading on expected market turbulence.⁴ The vocabulary that came with those tools, "bear market" and "bull market," has been in use since at least the 18th century.⁵ When a financial commentator says "we're in a bear market," every participant understands the shorthand. Conditions have shifted. Caution is warranted.
Real estate developed its own measurement infrastructure. The Case-Shiller Home Price Index, built from research by economists Karl Case and Robert Shiller in the 1980s, tracks repeat-sale price changes monthly across 20 metro areas.⁶ The National Association of Realtors has published existing home sales data monthly since 1968, including months-of-inventory supply, the metric that defines whether a market favors buyers or sellers.⁷ When Zillow launched in February 2006 and placed automated valuations on more than 100 million homes, it gave the general public access to pricing data that had previously required a professional intermediary.⁸
Each of these tools does the same thing. It makes market conditions readable to participants. And once conditions are readable, people can form different opinions about them. The "buyer's market versus seller's market" conversation in real estate is only possible because there's shared data to interpret.
This pattern extends well beyond stocks and real estate. Fragmented, independently owned small business sectors have built their own versions of market intelligence.
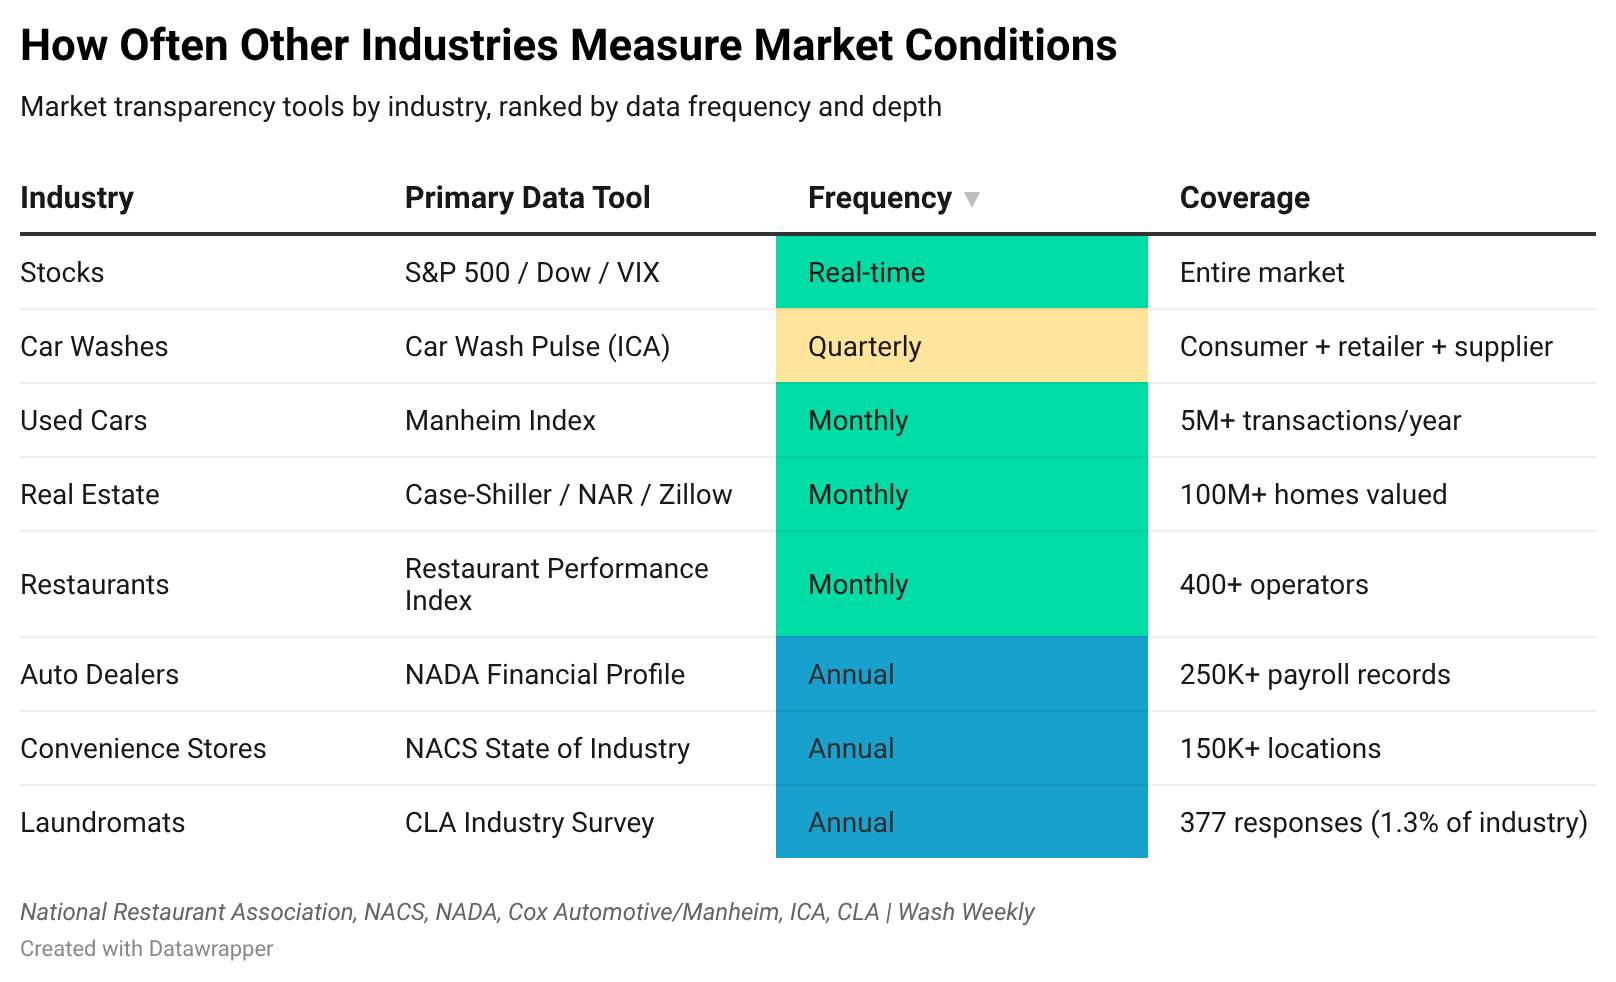
The National Restaurant Association launched its Restaurant Performance Index in 2002. It surveys more than 400 operators monthly and produces a single composite number. Above 100 means expansion. Below 100 means contraction.⁹ One number, published monthly, that any restaurant owner in America can reference.
The National Association of Convenience Stores has published its State of the Industry report continuously since 1972, producing more than 450 spreadsheets of historical data with category-level margins, quartile performance benchmarks, and per-store financial breakdowns across more than 150,000 locations.¹⁰
The National Automobile Dealers Association has collected actual dealer financial statements since 1979 and publishes departmental profitability data and workforce compensation benchmarks covering more than 250,000 payroll records.¹¹
The Manheim Used Vehicle Value Index, based on more than 5 million annual wholesale auction transactions, provides a monthly reading on wholesale pricing trends with a mid-month preview update.¹²
The International Carwash Association, an industry that shares structural similarities with laundromats, publishes quarterly research through its Car Wash Pulse program, surveying consumer behavior, retailer sentiment, and supplier outlook.¹³
The data we have
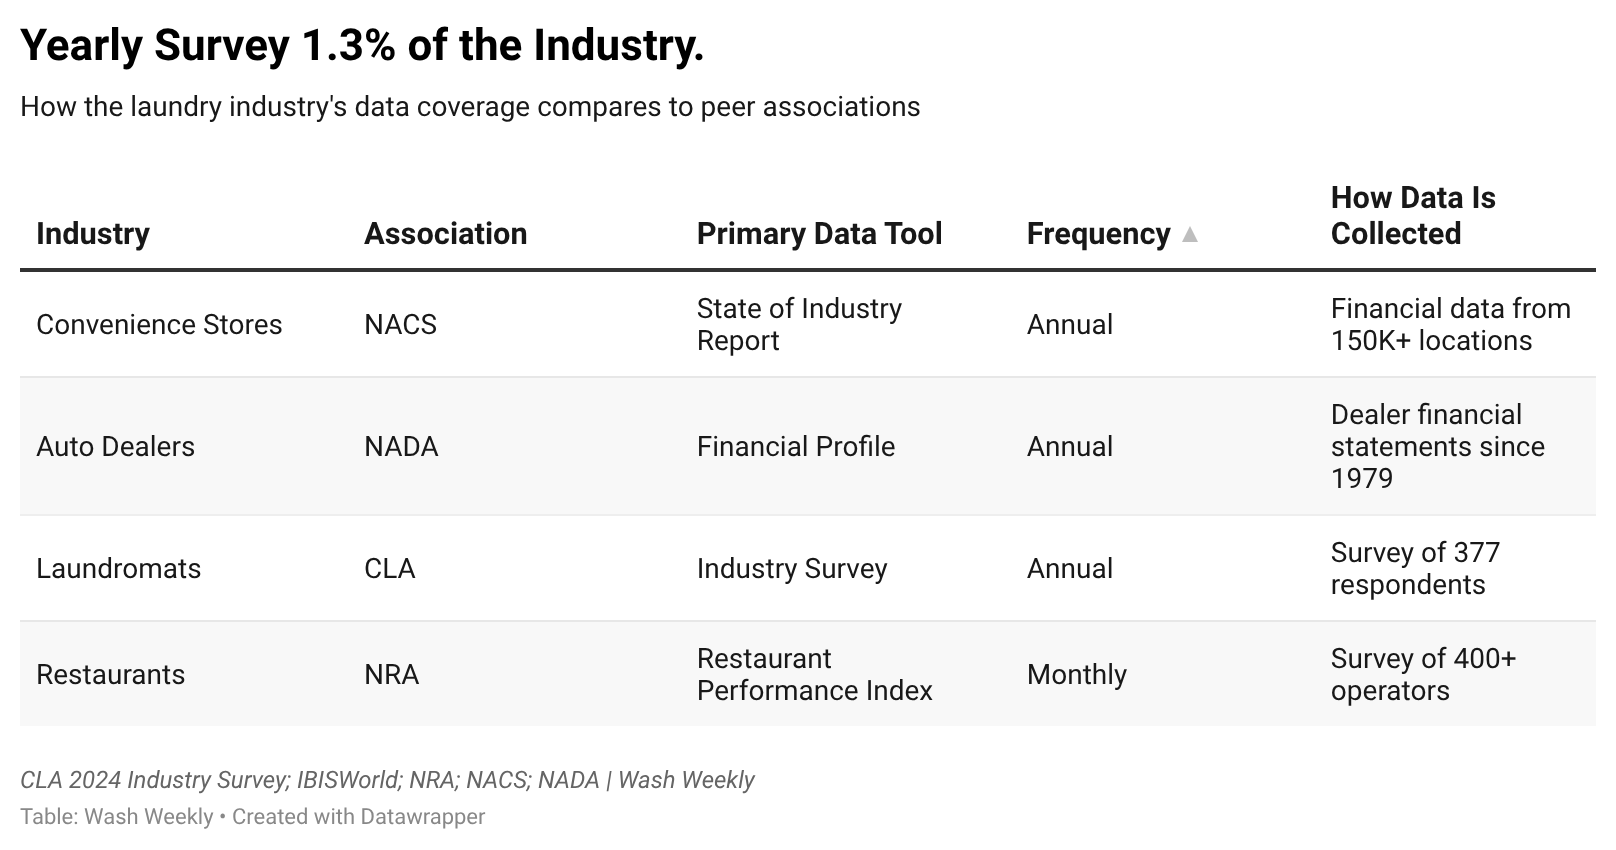
The CLA's annual Laundry Industry Survey is the most comprehensive data collection effort in the laundromat industry. The 2024 edition, the 28th annual, was conducted by Readex Research, a respected independent firm. They contacted 5,986 industry professionals and received 377 usable responses, a 6% response rate, which falls within the normal range for email-based industry surveys.¹⁴
Those 377 responses cover roughly 1.3% of the approximately 29,500 U.S. laundromat locations.¹⁵
The survey covers 25 questions on revenue ranges, utility costs as a percentage of gross revenue, operating net profit margins, vend prices, and employee counts. The 2024 results showed a median gross revenue of $335,000 and a median operating net profit of 27% of gross revenue. That profit figure is calculated before taxes, debt service, and owner compensation, a distinction the survey itself clearly states but one that sometimes gets dropped when the number is cited in other contexts.¹⁶
The survey was designed to profile laundry operations. What it doesn't do is function as a market conditions indicator. Transaction prices, acquisition multiples, equipment cost trends over time, and forward-looking operator sentiment fall outside its scope, and outside the scope of anything else currently published in the industry.
For context, the Restaurant Performance Index surveys more than 400 operators monthly and includes both a current conditions component and a forward-looking expectations component covering six-month outlook on same-store sales, staffing, and capital expenditure.¹⁷ The car wash industry publishes quarterly. The convenience store industry provides quartile-level benchmarks so operators can measure themselves against top performers, not just industry averages. Each of those industries built layers of data infrastructure over decades, piece by piece.
The laundry industry has one layer. One survey, once a year. The question is what gets built on top of it.
I've had conversations with other owner/operators who describe similar conditions in their markets. Elevated asking prices. Equipment costs climbing. These observations come up in industry conversations, but they come up casually. They don't have a framework. There's no shared vocabulary for saying "conditions in this market have shifted" the way a real estate agent can point to two months of supply and say "this is a seller’s market."
In other investment markets, those conditions would have a name. In ours, they don't. Not yet.
What a room with no reference points feels like
Casino designer Bill Friedman wrote about this in his book Designing Casinos to Dominate the Competition. Among his design principles: no clocks on the walls and no windows. Psychologist Mark Griffiths studied the resulting phenomenon, temporal distortion, the state where participants lose their ability to gauge how much time has passed and how much money they've spent.¹⁸ The mechanism is straightforward: remove the reference points, and people lose the tools to calibrate their decisions.
Commercial laundry equipment pricing has a similar absence of reference points. An MSRP exists between the manufacturer and the distributor, but there is no public-facing MSRP for the owner/operator. The buyer contacts an authorized distributor, receives a quote, and receives a price. There is no published price list to compare against, no historical pricing data to track trends over time.
A household washing machine at a retail store has a manufacturer's suggested retail price. A buyer can compare that price across multiple retailers, track whether it went up or down from last year, and reference a visible benchmark before deciding to purchase.
The commercial version of the same basic function, which might represent a $80,000 investment for a set of front-load washers, has no equivalent benchmark. An owner/operator receiving a quote today has no publicly available data point from six months ago or two years ago to understand how that quote fits into a larger pricing trend. Like a casino floor without clocks, the environment offers no reference points for orientation. The information needed to ask "is this price reasonable relative to where pricing has been?" simply isn't accessible.
The direction of incentives
Every market that has developed a vocabulary for "wait" or "hold" or "conditions have shifted" has done so because someone within that ecosystem benefited from delivering that message.
In the stock market, short sellers and bearish analysts have built entire careers on identifying when conditions are deteriorating. Their income is tied to being right about downturns. In real estate, buyer's agents benefit when their clients exercise patience in overheated markets, because better deals produce better long-term relationships and referrals. The presence of these counterweights means that bullish and cautious perspectives compete openly for attention.
In the laundry industry, I'm not aware of an equivalent counterweight. To my knowledge, there is no role, no business model, no platform whose financial success depends on fewer laundromats being sold or built. The most visible voices in the industry, the content that reaches the most people, tends to come from equipment manufacturers, distributors, brokers, coaches, course creators, and financing programs. Each has revenue that moves in the same direction, toward more transactions.
When the most widely distributed content in an industry shares a common incentive, and there's no equally visible counterpoint, the range of perspectives that reach owner/operators narrows. The conversation tilts toward one signal.
Economist George Akerlof's 1970 paper, "The Market for 'Lemons,'" explored what happens in markets where one side has significantly more information than the other. The research, which earned him the Nobel Prize in 2001, showed that information gaps between buyers and sellers distort rational pricing.²⁰ The laundromat market isn't a market for lemons. But it is a market where information is unevenly distributed. And the side with less information is the side hearing, from the widest range of sources, that it's always a good time to invest.
How a statistic traveled
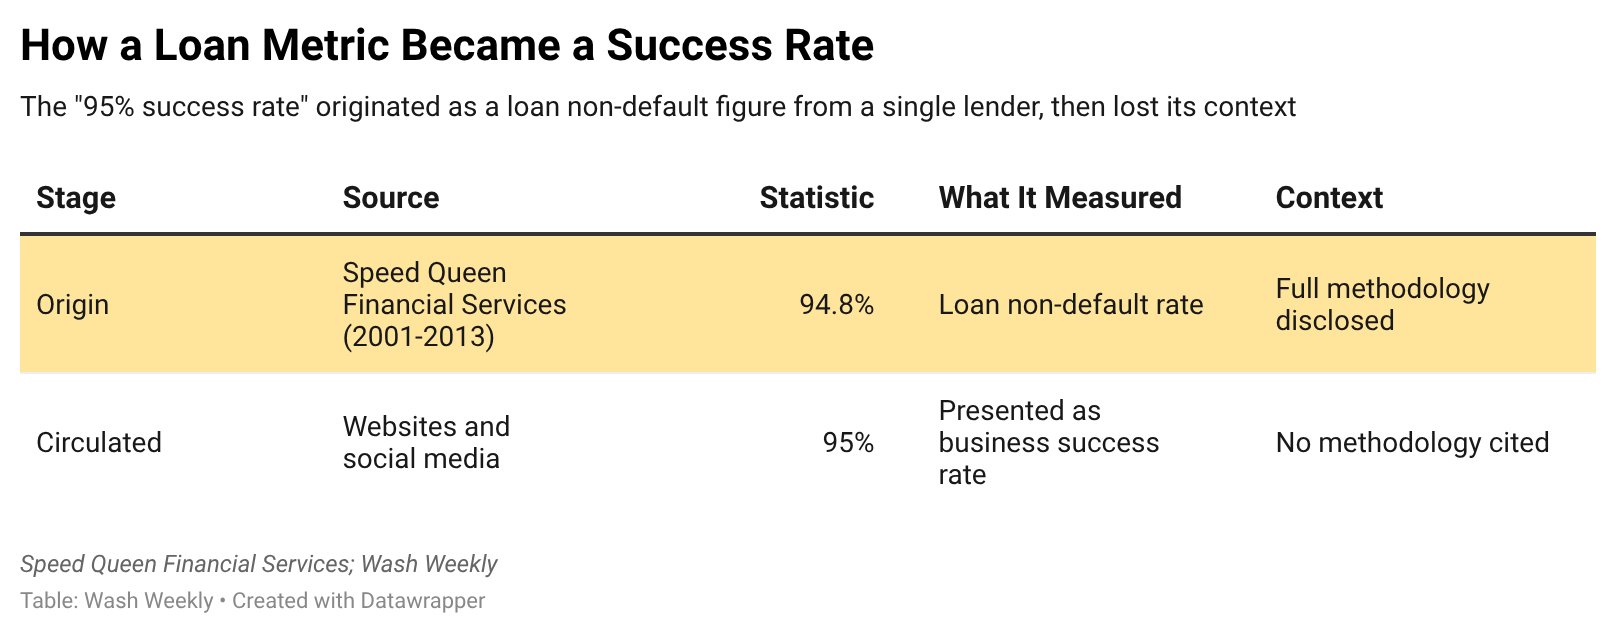
The most widely cited evidence for laundromat investment success is the "95% success rate." I traced the origin of that figure in an earlier Wash Weekly editorial, and the source turned out to be more specific than most people realize.²¹
Speed Queen Financial Services reported a figure of 94.8%, derived from their loan data between 2001 and 2013. The methodology measured the number of loans not charged off divided by the total number of loans originated.²² That's a loan performance metric. It measures whether borrowers defaulted on their financing. It doesn't measure whether those businesses were profitable, whether they grew, or whether they remained open beyond the loan period.
Alliance Laundry Systems published this data with the methodology noted in their footnotes.²³ What happened next is the more interesting part. As the number traveled across websites, social media platforms, marketing materials, and course promotions, the methodology fell away. The figure became a flat "95% success rate" presented as a measure of business success rather than loan performance.²⁴
A similar pattern appears with the "20-35% ROI" figure, which Speed Queen Commercial cites as "average cash-on-cash ROI."²⁵ That range appears in materials from manufacturers, distributors, and affiliated lending programs. It has not been independently verified by an academic study, government dataset, or third-party research firm. In most investment markets, unverified return claims would draw analysis from independent researchers. In laundry, the independent analyst role barely exists.
What Alliance's IPO opened up
On October 9, 2025, Alliance Laundry Systems began trading on the New York Stock Exchange under the ticker ALH, at $22 per share.²⁶ For the first time, the largest commercial laundry equipment manufacturer in North America was required to open its financial records to the public.
The S-1 filing revealed fiscal year 2024 revenue of $1.508 billion, adjusted EBITDA margins of 25-26%, and an estimated 40% share of the North American commercial laundry equipment market.²⁷
Alliance has been continuously private-equity-owned since 1998, when Bain Capital acquired it from Raytheon for $358 million. Ontario Teachers' Pension Plan purchased it for $450 million in 2005. BDT Capital Partners took a majority stake at an estimated $1.8 billion valuation in 2015.²⁸ After the IPO, BDT & MSD Partners retains approximately 76% ownership.²⁹
The S-1 projects growth for the industry, citing a commissioned Cambridge Group study estimating roughly 5% annual expansion through 2028 and highlighting "professionalization" trends among multi-site operators.³⁰
Meanwhile, IBISWorld data shows the number of U.S. laundromat establishments declining at a -1.5% compound annual growth rate, from approximately 18,843 in 2024 to a projected 17,461 in 2026.³¹
Both data points exist in the same industry. One projects growth. The other tracks decline. In markets with robust data infrastructure, contradictions like this generate public analysis and debate. In ours, they sit side by side without much examination.
The question the pattern leaves open
Markets where people invest their money have, over time, built the instruments for reading conditions. Real estate built the Case-Shiller Index and the months-of-inventory framework. The stock market built the bear market vocabulary and the VIX. Restaurants built the Restaurant Performance Index. Convenience stores built five decades of benchmarking data. The car wash industry built a quarterly pulse survey.
Our industry, after decades, hasn't.
The question isn't whether laundromats can be a good investment. They can. The question is what it tells us that an entire industry has no shared vocabulary for market conditions. No index. No transaction record. No quarterly sentiment reading. No published equipment pricing history. No framework for "conditions in this market have shifted."
Is the timing always right? Or have we just never built the instrument that would tell us when conditions have changed?
Thinking about the thinking of laundry:
When you realize a thermometer doesn't make you sick and doesn't make you well. It just tells you your temperature. What you do with the reading is up to you.
That's all I got for you today.
Waleed
PS: A late in your inbox today. This editorial required a little more research, more sourcing, and more time than a standard Sunday edition. It was worth the wait.
PPS: Tomorrow, Wash Weekly becomes a membership publication. Your first month is still $1.
Echoing the thoughts of Daniel Kahneman.
We can be blind to the obvious, and we are also blind to our blindness.
Footnotes:
¹ Joshua Zumbrun and Brian Wingfield, "America's Fastest-Dying Industries," Forbes, April 11, 2008 — original Forbes URL no longer active; full text preserved with industry rebuttal by Larry Larsen
² IBISWorld, "Laundromats in the US," Industry Report 81231 (2026)
³ Measuring Worth, "Growth Rates of U.S. Stock Indexes" — DJIA data from 1896
⁴ CBOE, "VIX Volatility Products" — launched 1993
⁵ Savant Wealth Management, "'Bulls' and 'Bears': Where Do Those Terms Come From?"
⁶ Mortgage News Daily, "Home Prices — Case-Shiller Index"
⁷ National Association of Realtors, monthly existing home sales data published since 1968
⁸ Zillow Research, "Zillow Home Value Index Methodology" — launched February 2006
⁹ National Restaurant Association, "Restaurant Performance Index" — launched 2002
¹¹ NADA, "Annual Financial Profile of America's Franchised New-Car Dealerships" (2024)
¹² Cox Automotive/Manheim, "Manheim Insights" — based on 5M+ annual wholesale transactions
¹³ International Carwash Association, "Car Wash Pulse" — quarterly survey program
¹⁴ CLA, "2024 Laundry Industry Survey," conducted by Readex Research. Survey sample: 5,986; usable responses: 377; response rate: 6%
¹⁵ IBISWorld, "Laundromats in the US Number of Businesses Statistics"; CLA Industry Overview
¹⁶ CLA 2024 Survey, Questions 16 and 19. Median gross revenue: $335,000. Median operating net profit: 27% of gross revenue (before taxes, debt service, and owner compensation)
¹⁷ National Restaurant Association, Restaurant Performance Index methodology
¹⁸ Mental Floss, "Why Don't Casinos Have Windows?"; Bill Friedman, Designing Casinos to Dominate the Competition (2000)
¹⁹ George Akerlof, "The Market for 'Lemons': Quality Uncertainty and the Market Mechanism," The Quarterly Journal of Economics, Vol. 84, No. 3 (1970). Nobel Prize awarded 2001.
²⁰ Wash Weekly, "Why Isn't Every Laundromat Successful?" (May 2025)
²¹ Speed Queen Financial Services, loan performance data 2001-2013, cited via Wash Weekly investigation
²² Alliance Laundry Systems Distribution, "Laundromat Investments"
²³ Wash Weekly, "Why Isn't Every Laundromat Successful?" — documents how the figure traveled
²⁴ Speed Queen Commercial, "Why Invest in Laundromats"
²⁵ American Coin-Op, "Alliance Laundry Holdings Completes IPO" (October 2025)
²⁶ Alliance Laundry Holdings Inc., S-1/A filing with SEC, filed September 29, 2025
²⁷ Alliance Laundry Systems corporate history: Bain Capital acquisition from Raytheon (1998); Ontario Teachers' Pension Plan acquisition (2005); BDT Capital Partners majority stake (2015)
²⁸ Alliance Laundry Holdings Inc., S-1/A — BDT & MSD Partners post-IPO ownership approximately 76%
²⁹ Alliance Laundry Holdings Inc., S-1/A — cites Cambridge Group commissioned study
³⁰ IBISWorld, "Laundromats in the US" — establishment count trends


